

Short answer: Incrementality is the part of your sales that would not have happened without the ads. Attribution cannot measure it, because it only shares out credit for sales that already happened, so every platform claims customers who would have bought anyway. You measure incrementality with experiments: geo holdouts, conversion lift studies and brand pause tests, where one group sees the ads and a matched group does not. Marketing mix modeling (MMM) estimates the same thing statistically from two or more years of weekly spend and sales data, across all channels at once. At $100K+ a month, run clean tracking first, then one lift test a quarter on your biggest question, and add MMM, calibrated with those tests, once you spend across four or more channels.
This guide is for brands spending $100,000 or more a month on paid media who no longer trust what the ad platforms report. In 222 growth strategy calls with founders and marketing leaders, tracking nobody trusts came up 145 times, more than any other problem. Most of those teams did not need a new dashboard. They needed a way to know which spend creates new customers and which spend only collects credit. If your conversion data itself is broken, start with server-side tracking before you scale. This page is about the next step: proving what the ads add.
What we hear about measurement on growth strategy calls
The words change, the problem does not:
- “That attribution takes sales that don’t exist. I see that daily sales are not 6 or 9 thousand, but sometimes four thousand.”
- “We did not see a huge uplift, more like cannibalization.”
- “We simply don’t have any way to attribute.”
- “Setting up attribution, tracking. This has been an issue for us for years and years.”
- “There is a very large direct attribution. Can we expect to solve this?”
On one account we reviewed, the ad channels together reported 32% revenue growth on the year. The company’s actual revenue grew 3%. Nobody had lied. Each platform counted the customers it touched, several platforms touched the same customers, and some of those customers would have bought anyway. That gap is what incrementality measures.
Attribution, incrementality and MMM: what each one answers
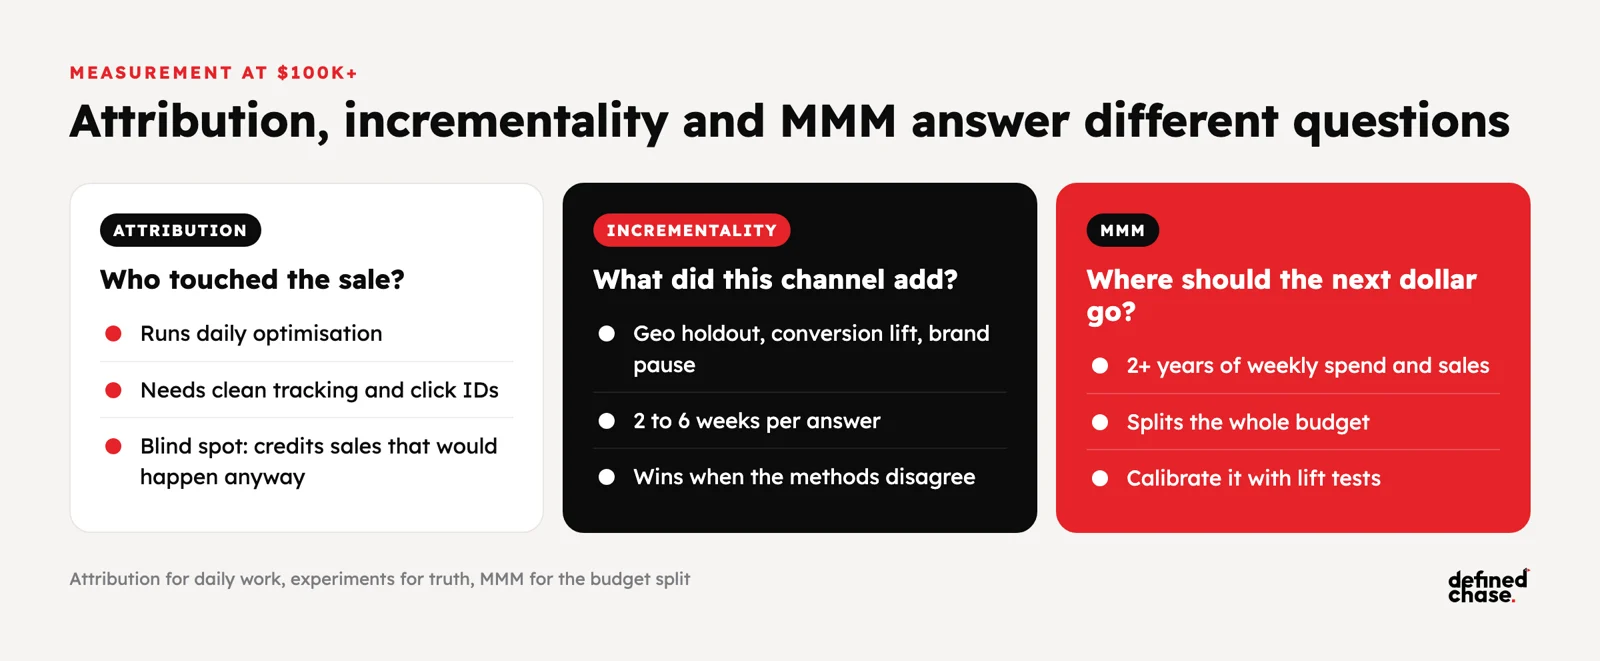
These three are often sold as rivals. They answer different questions, and at scale you need all three, used for different decisions.
| Method | The question it answers | What it needs | Speed | Blind spot |
|---|---|---|---|---|
| Attribution (platform, GA4, MMP or a tool like Triple Whale) | Which touchpoints were on the path to each sale? | Clean tracking, click IDs kept to the CRM, one source of truth | Daily | Credits sales that would have happened anyway; platforms double count |
| Incrementality tests (geo holdout, conversion lift, brand pause) | How many extra sales did this channel or campaign cause? | A test group, a matched control group, enough volume, 2 to 6 weeks | One answer per test | Answers one question at a time; needs volume to be readable |
| Marketing mix modeling (MMM) | How much does each channel add across the whole business, and where is the next dollar best spent? | Two or more years of weekly spend, sales and outside factors, with real variation in spend | Monthly or quarterly refresh | Slow to react; wrong if not checked against experiments |
The simple rule: attribution runs the day-to-day optimisation, experiments tell you the truth about one channel, and MMM tells you how to split the whole budget. When the three disagree, the experiment wins.
Signs you are paying for sales you would get anyway
Before any test, look for the usual places where ads take credit without adding much. These come from our audits and growth strategy calls:
| Where credit leaks | What we find | What to check |
|---|---|---|
| Brand search | Performance Max campaigns buying the brand name because brand exclusions were missing; on one account brand terms were 2.8% of clicks but 11% of reported revenue | Brand exclusions in Performance Max, then a brand pause test in a few regions |
| Prospecting that reaches customers | Cold campaigns without customer exclusions, frequency close to 6, and “remarketing” expanded into broad targeting | Exclude buyers and recent visitors from prospecting, then measure new customers only |
| Platforms adding up to more than the business | Platform revenue growth of 32% against real growth of 3%; leads counted up to 5 times across tools | Sum all platform conversions each month and compare to the backend |
| View-through credit | Post-view conversions on display and video counted the same as clicks | Report view-through separately; prove it with a lift test, not a window setting |
| Payment and direct traffic | A payment provider or “direct” taking a large share of revenue in GA4 as the last touch | Fix referral exclusions and keep click IDs to the order |
None of this means the channel is useless. Brand search often does protect sales from competitors. The point is to find out how much, instead of assuming 100% or 0%.
How to run an incrementality test
There are three test types we use, from simplest to most robust:
- Brand pause test. Switch off brand search in a few regions or for a few weeks and watch total brand sales, not just paid brand sales. Fast and cheap, and it settles the most common argument in the account.
- Platform conversion lift. Meta Conversion Lift and Google’s lift studies hold out a random group of people from your ads and compare their purchases with the people who saw them. Good for one channel, but the platform runs and reads its own test.
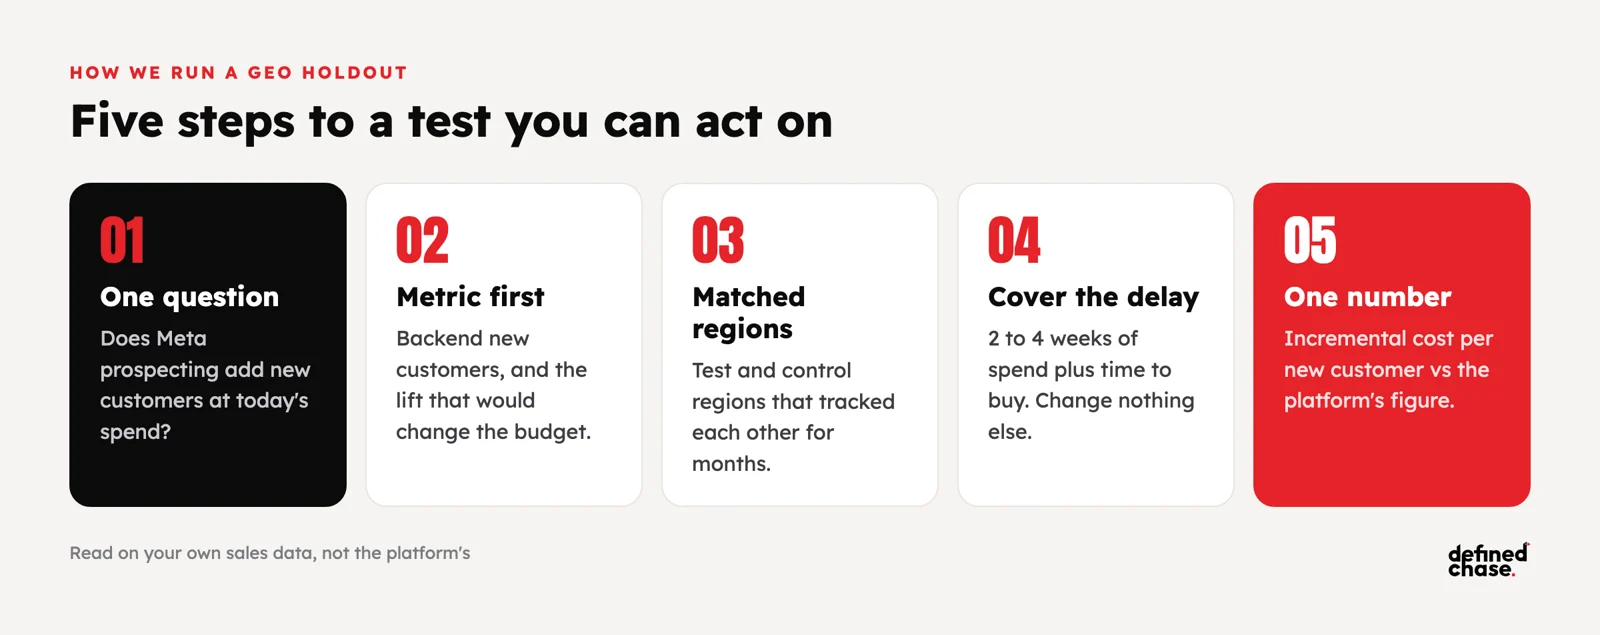
- Geo holdout. Split your markets into matched regions, keep spend on in the test regions and switch it off or down in the control regions, then compare sales from your own backend. This is the most trustworthy, because your data, not the platform’s, decides.
The rules that make a test readable
- One question per test. “Does Meta prospecting add new customers at our current spend?” is testable. “Is our marketing working?” is not.
- Write the success metric down first. New customers or revenue from your backend, with the minimum lift that would change a budget decision.
- Match the groups on history. Regions or audiences should have tracked each other closely for months before the test.
- Run long enough to cover the delay. Two to four weeks of spend, plus the time it takes people to buy. On one account we watched conversions keep arriving for about three weeks after the click.
- Change nothing else. No new promotions, prices or creative pushes in only one group.
The output you want is one number: incremental cost per new customer, the spend in the test divided by the extra customers it caused. Compare it with the cost per customer the platform reports. The gap tells you how much to trust that platform’s numbers from now on.
Marketing mix modeling: when it is worth it
MMM is a statistical model of your sales over time. It takes weekly spend by channel, plus things like seasonality, price changes, promotions and organic demand, and estimates how much each channel adds and where returns start to fall. It needs no cookies or user tracking, which is why it has come back since privacy changes cut attribution data, and Google’s open-source Meridian and Meta’s Robyn have made it far cheaper to run.
It is worth it when three things are true:
- You spend across four or more channels, including some that attribution cannot see well, such as YouTube, CTV, display, podcasts or offline.
- You have at least two years of weekly data, with spend that moved up and down. A model cannot learn from a budget that never changed.
- You will act on it. MMM pays off when it moves budget between channels each quarter. If the plan is fixed, do not build the model.
The common mistake is to trust the first model. MMM can produce very different answers from the same data. Calibrate it with your lift tests: if a geo test showed Meta prospecting adds a certain number of customers per dollar, the model should agree before you use it to move money.
Measuring brand and upper-funnel spend
Awareness campaigns on YouTube, CTV and display almost never win on last-click attribution, so they get cut first. In our DV360 brand work we prove them with four numbers, read together:
- Brand Lift studies for awareness, recall and consideration, with a baseline wave before launch and a second wave later.
- Lifted users and cost per lifted user: how many people the campaign actually moved, and what each one cost.
- Branded search volume, compared with the category, as a sign that demand is growing.
- Blended cost per acquisition across all channels, not the DV360 line on its own.
On one subscription product, 12 months of an always-on brand layer on top of performance came with 80% more branded search year on year and a lower blended CPA while performance spend grew five times. More on that in when DV360 is worth adding.
Which method to use at your stage
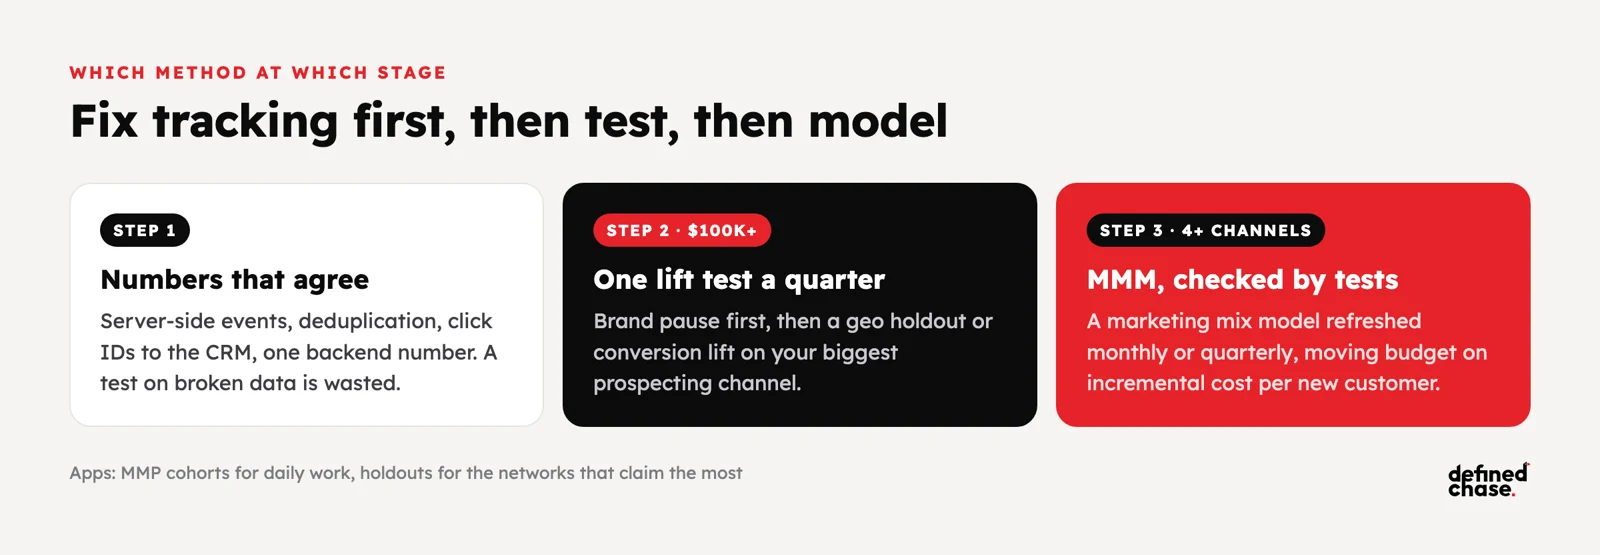
Measurement grows in three steps. Each step only pays off when the one before it is done.
| Where you are | What to measure with | First test to run |
|---|---|---|
| Tracking not trusted yet | Fix conversions first: server-side events, deduplication, click IDs to the CRM, one backend number | None yet; a test on broken data is wasted |
| $100K to $300K a month, 2 to 3 channels | Platform attribution for daily work, backend new customers for decisions, one lift test a quarter | Brand pause test, then a Meta conversion lift or geo holdout on prospecting |
| $300K+ a month, 4+ channels or upper funnel | MMM refreshed monthly or quarterly, calibrated with geo holdouts | Geo holdout on the channel the model is least sure about |
| Apps | MMP cohorts (AppsFlyer, Adjust, Singular) for daily work, lift tests for the big networks | Holdout on the channel that claims the most installs |
For the Meta side of this, including Conversion Lift, see how to scale Meta ads past $100K a month. For how the results reach the CEO, see the one-page CEO marketing report.
How we run it at Defined Chase
We start every account by making the numbers agree: server-side events, deduplication, click IDs kept to the CRM and one monthly reconciliation of platform totals against the backend. Then we list the three biggest questions in the budget, usually brand search, prospecting on the largest social channel and the upper-funnel layer, and test one per quarter with a brand pause, a conversion lift or a geo holdout read on your own sales data. For brands spending across four or more channels we add a marketing mix model, checked against those tests, and move budget on incremental cost per new customer, not on platform ROAS. See how we set up tracking and measurement for brands at this budget, or start with a free Growth Map Call to find which part of your spend is doing the work.
FAQ
What is incrementality in marketing?
The extra sales, sign-ups or installs that happened because of your ads, compared with what would have happened without them. It is measured by comparing a group that saw the ads with a matched group that did not.
What is the difference between incrementality and attribution?
Attribution shares out credit for sales that happened among the touchpoints on the path. Incrementality asks whether those sales would have happened anyway. A channel can have strong attribution and low incrementality, which is common for brand search and retargeting.
What is marketing mix modeling?
A statistical model that estimates how much each channel adds to sales, using weekly spend and sales data over two or more years together with factors like seasonality and price. It needs no user-level tracking. Google Meridian and Meta Robyn are free open-source versions.
How long should an incrementality test run?
Usually two to four weeks of spend, plus your normal time to purchase. Longer for high-price or B2B products where people take weeks to decide.
How much budget do I need for a geo holdout test?
Enough that the test regions produce a few hundred conversions in the test period, so the difference between groups is larger than normal week-to-week noise. Below that, start with a brand pause test or a platform conversion lift study.
Is MMM worth it for a brand spending $100K a month?
Only if you spend across four or more channels and have two years of weekly data with real changes in spend. With two or three channels, clean backend tracking plus one lift test a quarter answers more for less.
Should I turn off brand search to save money?
Test it first. Pause brand search in a few regions or weeks and compare total brand sales with the control. Some brands lose sales to competitors bidding on their name; others lose almost nothing.
Updated 22 October 2026.
How we do this for clients: Server-side tracking and GA4 →
Want to scale your ad spend?
On a free Growth Map Call we find what is capping your ad spend and the next 1 to 3 steps.
Attend a Growth Map CallRelated articles
CEO marketing report: spend to payback on one page
What a monthly CEO marketing report should show at $100K+ a month: spend, revenue, new customers, CAC payback, LTV:CAC and one budget…
Oct 20, 2026 · 8 min readIs Your Ad Tracking Lying to You? Server-Side Tracking, GA4 and Offline Conversions Before You Scale
Short answer: your ad tracking is lying to you if the conversions reported by Meta, Google Ads and GA4 differ from your…
Oct 16, 2026 · 7 min read