

Short answer: a marketing report for the CEO should answer one question: what did the spend give us, and should we spend more? At $100K+ a month, put it on one page: total spend, revenue and the balance left after ad spend, new customers from your backend, cost per new customer, CAC payback and LTV:CAC, with awareness spend shown apart from performance spend and brand search apart from non-brand. Compare each number with last month and last year, show the tracking gap, and end with one decision about the next budget step. Platform ROAS and click metrics belong in the appendix, not on the page.
This guide is for brands spending $100,000 or more a month on paid media. It draws on 222 growth strategy calls with founders and marketing leaders, where reporting that answers nothing came up 44 times and tracking nobody trusts another 145 times. For the weekly view the growth owner runs on, see our weekly marketing scorecard. This page is the monthly view the CEO and the board read.
What the CEO is actually asking
On our calls, founders and CEOs rarely ask for more metrics. They ask for an answer they can act on.
- “Right now I see two thousand euros in the invoice. I would like to see what those two thousand are for.”
- “We don’t know how to measure the impact of it. We basically burned the money just for the branding.”
- “So these numbers aren’t very correct and true.”
- “If codes are dropping, total registrations are dropping, and campaigns show some other improvement, how do I interpret all of this?”
- “I just jump between platforms, Meta, Adjust, then here. It’s not really my area.”
Every one of those is the same request: show me money in, money out, and what we do next, in numbers I can trust without opening five tools.
Why most marketing reports do not answer it
Most reports are built from what the platforms export, so they answer the questions the platforms ask. Click-through rate, CPM and platform ROAS tell a channel buyer how a campaign is doing. They do not tell a CEO whether the business bought customers at a cost it can afford. On audits we see the same four problems again and again:
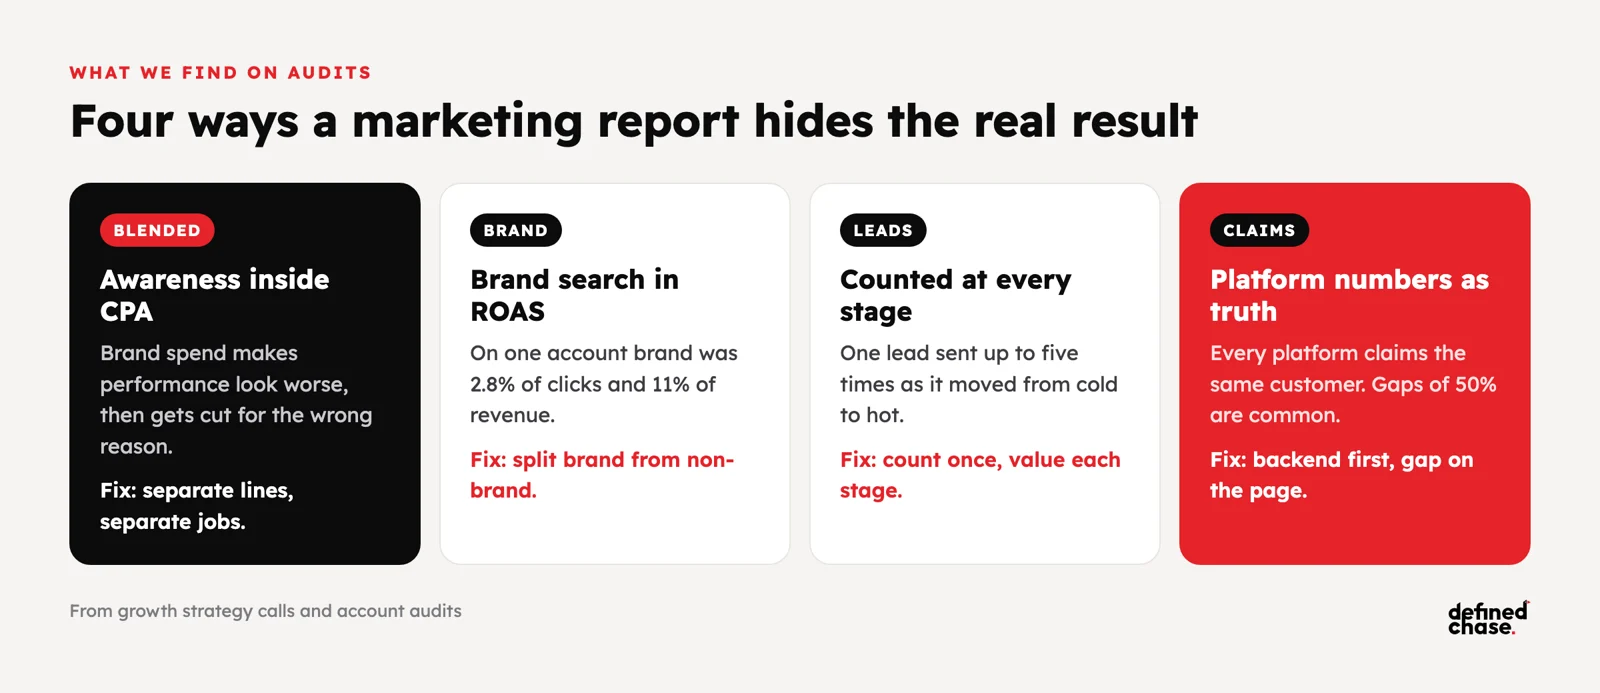
| What the report does | What it hides | The fix |
|---|---|---|
| Puts awareness spend (DV360, YouTube reach) inside one blended CPA | Performance looks worse than it is, and brand spend gets cut for the wrong reason | Show performance and awareness spend on separate lines, judge each on its own job |
| Counts brand search in performance ROAS | People who already knew you make paid look stronger. On one travel account, brand search was 2.8% of clicks and 11% of revenue | Split brand from non-brand; growth shows up in non-brand |
| Sends a conversion every time a lead changes stage | One real lead is counted up to five times, so cost per lead looks five times better | Count each lead once, then send qualified and closed stages as separate, valued events |
| Uses platform-reported conversions as the result | Google, Meta and TikTok claim the same customer. We have seen gaps of 50% between platforms and the backend | Use backend orders, paid subscriptions or closed deals, and show the gap as its own line |
Fix those four and most reports get shorter, not longer. Most of the metrics people add to a report are there because the core numbers are not trusted.
The one-page CEO marketing report
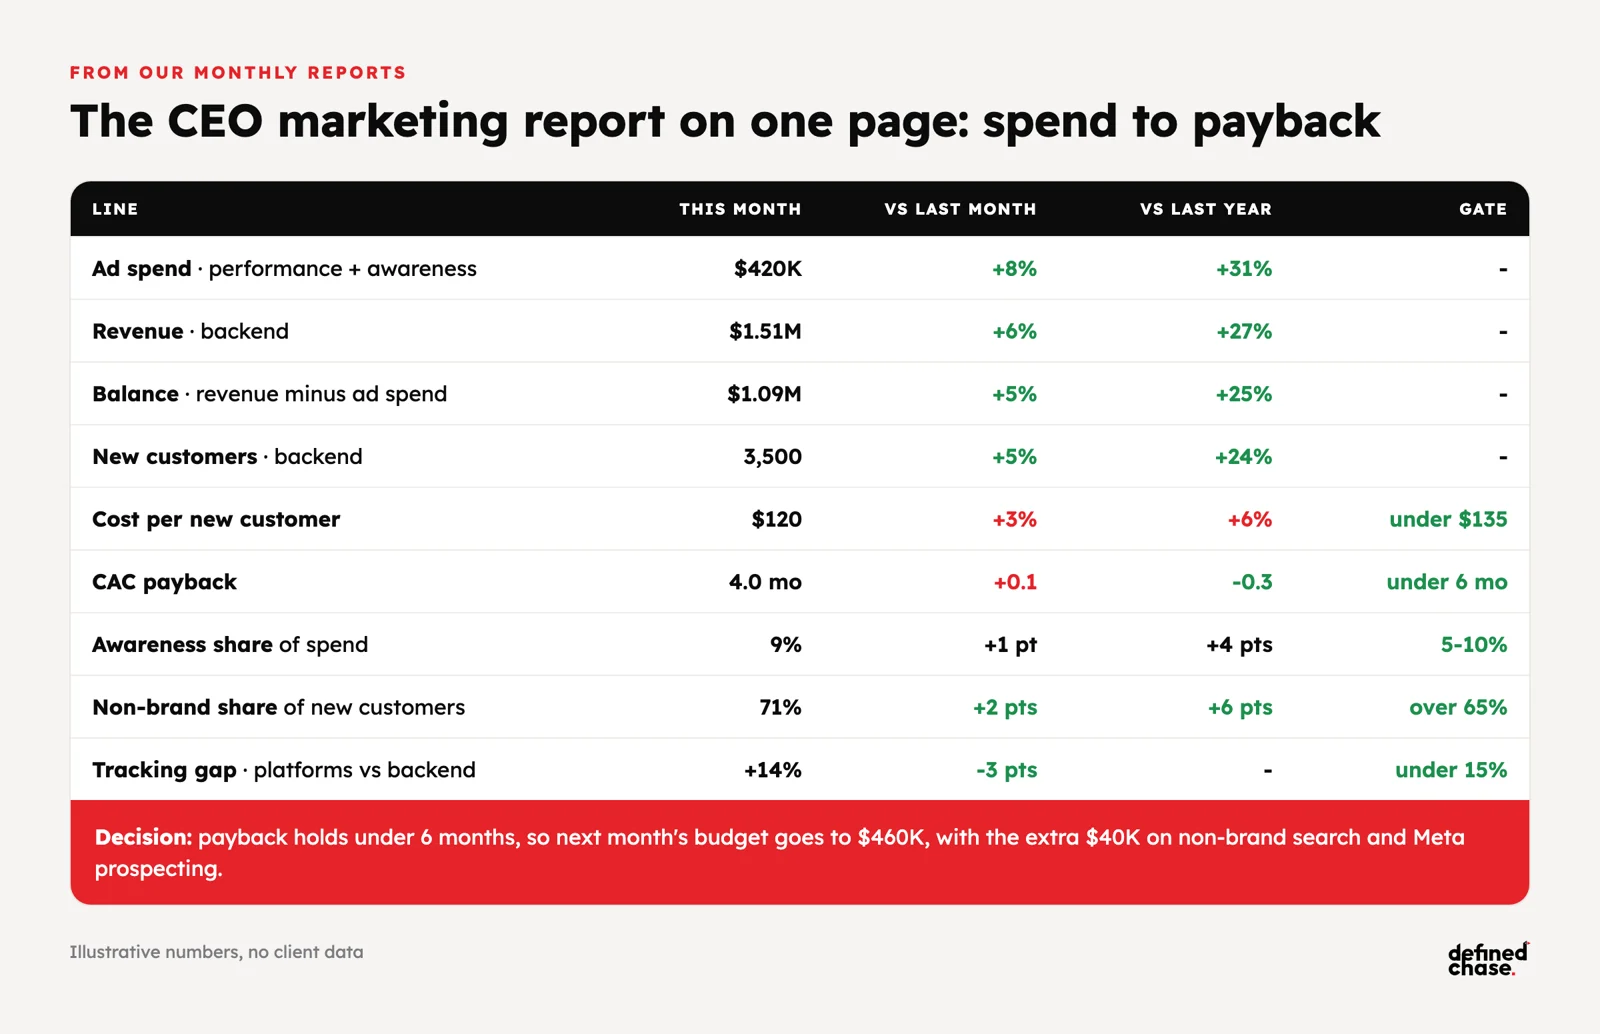
Our own monthly report opens with the same executive summary for every account: spend, revenue, balance, ROAS, cost per acquisition and order value, each against last month and last year. Then it splits performance from awareness and brand from non-brand before any channel detail. For a CEO at $100K+ a month, the page we recommend adds customers and payback:
| Block | Lines | Source |
|---|---|---|
| 1. Money in, money out | Total ad spend, revenue, balance (revenue minus ad spend), marketing efficiency ratio | Backend, finance, ad platforms |
| 2. Customers | New customers, cost per new customer (blended CAC), first-order value | Backend or CRM |
| 3. Payback | CAC payback in months, LTV:CAC from a cohort you trust | Finance |
| 4. Where the money went | Performance vs awareness spend; brand vs non-brand; paid vs organic new customers | Ad platforms and backend |
| 5. Trust | Tracking gap: platform-claimed conversions vs backend for the same month | Platforms and backend |
| 6. The decision | Next month’s budget, which channel gets it, and the gate that has to hold | The growth owner |
Every number appears with two comparisons: last month and the same month last year. Month over month shows direction, year over year removes seasonality. If a number cannot be filled from your own backend, the page should say so rather than fill it from a platform.
How to calculate CAC payback
CAC payback is how many months it takes a new customer to earn back what it cost to acquire them. It is the number that tells a CEO how much growth the cash can carry.
- Cost per new customer. Total paid media spend for the month divided by new customers from the backend. Add agency and creative costs if you want the fully loaded version, and say which one you use.
- Monthly gross margin per customer. Revenue per customer per month, minus the cost of delivering it.
- Payback in months. Cost per new customer divided by monthly gross margin per customer.
Example with illustrative numbers: $420,000 of spend brings 3,500 new customers, so the cost per new customer is $120. Each customer leaves $30 of gross margin a month, so payback is four months. For one-off purchases, use first-order margin plus the repeat margin you see in a 90-day cohort.
LTV:CAC compares the margin a customer brings over its life with what it cost. Use a cohort old enough to trust, not a projection. A shorter payback means the same cash can fund more growth. On one B2B SaaS account, campaigns were paying back ad spend in about 15 months. With finance agreeing that window, that was a case to raise the budget, not to cut it.
Weekly, monthly, quarterly: who reads what
| Cadence | Reader | Purpose | Decides |
|---|---|---|---|
| Weekly scorecard | Growth owner and channel leads | About ten lines against last week, the four-week average and the gate | Small budget moves, creative, fixes |
| Monthly CEO page | CEO, CFO, founder | Spend to payback on one page, vs last month and last year | The next budget step |
| Quarterly review | Board or leadership team | Payback and LTV:CAC by cohort, incrementality test results, channel mix | Gates for the next quarter, new channels or markets |
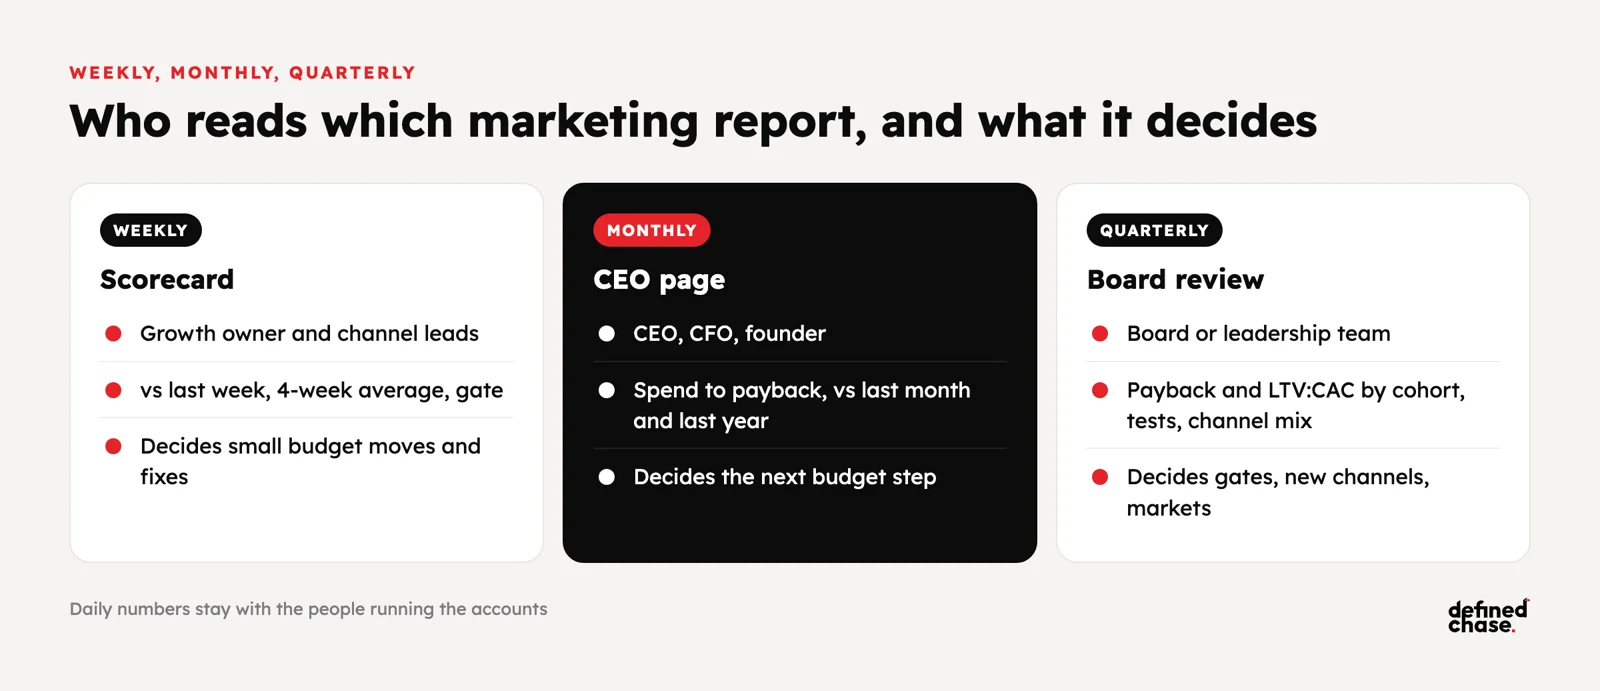
Daily numbers are for the people running the accounts. At this level of spend they are too noisy to move budget on, and sending them to the CEO trains everyone to react to noise.
Common mistakes in marketing reports for leadership
- Thirty slides. If the decision is on slide 28, nobody reads it. Put the decision first.
- Platform ROAS as the headline. It is a channel metric. The CEO needs revenue minus spend and payback from the backend.
- No year-over-year line. Without it, every seasonal dip looks like a crisis and every peak looks like a win.
- Awareness judged on cost per acquisition. Brand spend is judged on reach and brand lift, then on blended results over months. See when to add DV360.
- No tracking gap shown. If the platforms claim far more than the backend, say so on the page and fix it. Our guide to server-side tracking before you scale has the 30-day reconciliation test.
- A report with no decision. A report that ends without a budget call is an update, not a report.
How to build it in four steps
- Agree the source of truth. Which backend number counts as a new customer, and which finance number counts as margin.
- Split the spend. Tag campaigns as performance or awareness, and brand or non-brand, so the split is automatic every month.
- Set the payback gate. The payback or cost per new customer that unlocks the next budget step, agreed with finance before the month starts.
- Write the decision. One paragraph at the top: what happened, what we change, how much budget goes where next month.
If the report shows platforms claiming more growth than the business made, test it: our incrementality and MMM guide covers brand pause tests, geo holdouts and conversion lift.
How we run it at Defined Chase
We work with brands spending $100K+ a month that want to spend more. Every account gets a weekly report and a monthly report with the same structure: an executive summary of spend, revenue, balance, ROAS, cost per acquisition and order value against last month and last year, then performance vs awareness, brand vs non-brand and the channel view. Live numbers sit in a client portal, so nobody waits for a PDF. A strategy lead owns the full number with you and brings one budget decision to the monthly review, built from your backend rather than platform claims. See how we run performance marketing for brands at this budget, or start with a free Growth Map Call to find what is capping your spend.
FAQ
What should a marketing report for the CEO include?
Total spend, revenue and the balance after ad spend, new customers from the backend, cost per new customer, CAC payback and LTV:CAC, with performance vs awareness, brand vs non-brand and paid vs organic split out. Add the tracking gap and one decision about next month’s budget. Keep it to one page.
What is the difference between a marketing dashboard and a CEO report?
A marketing dashboard shows live numbers for the people running the channels. A CEO report is a monthly page that answers whether the spend paid off and what changes next. The dashboard feeds the report; it does not replace it.
What is CAC payback?
The number of months it takes a new customer’s gross margin to cover what it cost to acquire them. Calculate it as cost per new customer divided by monthly gross margin per customer.
What is a good CAC payback period?
The one your cash can carry. Subscription businesses often aim for 12 months or less, and e-commerce brands often want the first order or the first 90 days to pay back. Agree the target with finance and track the trend each month.
How should brand awareness spend be reported?
On its own line, never inside a blended cost per acquisition. Report reach, frequency and brand lift for awareness, then judge its effect on blended new customers and search demand over several months.
How often should the CEO see marketing numbers?
Monthly for the one-page report and the budget decision, quarterly for the bigger review with the board. The weekly scorecard stays with the growth owner and the channel leads.
Updated 20 October 2026.
How we do this for clients: Server-side tracking and GA4 →
Want to scale your ad spend?
On a free Growth Map Call we find what is capping your ad spend and the next 1 to 3 steps.
Attend a Growth Map CallRelated articles
Incrementality and Marketing Mix Modeling: A Practical Guide at $100K+
How to measure what your ads really add at $100K+ a month: attribution vs incrementality vs MMM, geo holdouts, conversion lift, brand…
Oct 22, 2026 · 9 min readIs Your Ad Tracking Lying to You? Server-Side Tracking, GA4 and Offline Conversions Before You Scale
Short answer: your ad tracking is lying to you if the conversions reported by Meta, Google Ads and GA4 differ from your…
Oct 16, 2026 · 7 min read