

Short answer: past $100K a month in ad spend, growth stalls less from bad campaigns than from nobody owning the full number. Name one person who owns spend, new customers, cost per new customer and payback across every channel, and give them one weekly marketing scorecard: about ten numbers from trusted data, each compared with last week, the four-week average and an agreed gate, plus one written decision. Channel teams keep their platform metrics, but budget moves only on the scorecard. If the scorecard cannot be filled from your own backend, fix tracking before you raise spend.
This guide is for brands spending $100,000 or more a month on paid media. It draws on 222 growth strategy calls with founders and marketing leaders. “Nobody owns budget and execution together” came up 59 times, and reporting that answers nothing another 44 times. The two problems are one problem: when no one owns the number, every team reports its own.
What “nobody owns the number” sounds like
On our calls it rarely sounds like an org chart problem. It sounds like people carrying pieces of the number and nobody carrying the whole.
- “Someone is responsible for the month, someone else is responsible for TV, radio, so in the end it’s scattered across everyone.”
- “There aren’t any who both manage the budget and handle the execution?”
- “Everything is handled by one person, where it is not the main focus.”
- “Our current person does a good job with existing, does a good job with a few other things, and simply those other things take over.”
And the reporting side of the same gap:
- “I want to see sales, the real performance, how much I generate, how much I spend.”
- “I have always wanted to see one common table where you can see the money spent, first purchases, how many are paid, how many are organic.”
- “Everyone wants accountability, what it gave.”
Nobody on those calls asked for more dashboards. They asked for one table and one person who answers for it.
Why every channel can look fine while growth stalls
Each platform grades its own homework. Google, Meta and TikTok each claim credit for the same customer, so the sum of platform conversions is usually higher than the orders in your backend. A Meta buyer who hits their platform ROAS target and a Google buyer who hits theirs can both be right while the business buys customers at a loss. The person who would notice is the owner of the full number, and that is the seat most often left empty.
| Without one owner | With one owner |
|---|---|
| Each channel reports its own ROAS or CPA | One number decides: cost per new customer and payback from your backend |
| Budgets set once a quarter, then defended | Budget moves every week toward the channel with the best next dollar |
| Meetings about whose numbers are right | One scorecard everyone uses, with the tracking gap shown on it |
| Wins are claimed, losses are explained | Each week ends with one written decision and who acts on it |
| The CEO asks “what did the spend give us?” | The CEO reads one page and sees spend, new customers and payback |
What the growth owner owns
The growth owner is a role, not a title. It can be a head of growth, a CMO, a founder or a senior partner lead working next to your team. What matters is the scope:
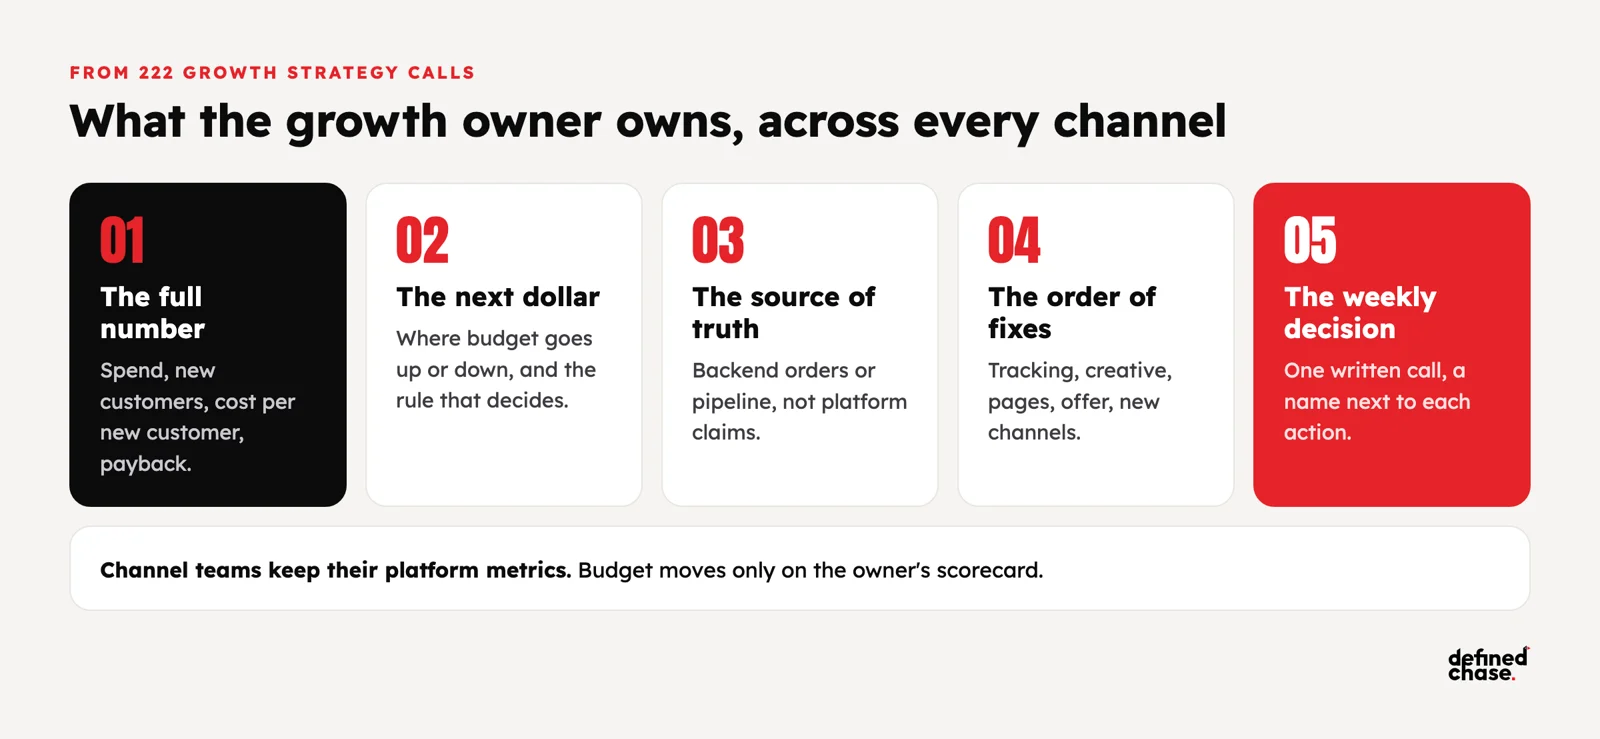
- The full number. Total spend, new customers, cost per new customer, payback. Across every channel, not one.
- The next dollar. Where budget goes up, where it comes down, and the rule that decides it.
- The source of truth. Which numbers count. Backend orders, paid subscriptions or qualified pipeline, not platform-reported conversions.
- The order of fixes. Tracking, creative, landing pages, offer, new channels: what gets fixed first and why.
- The weekly decision. One written call each week, with a name next to each action.
Channel specialists, creative and tracking people still do the work. The owner does not have to run the ads. They have to answer for the number and have the authority to move budget.
The weekly marketing scorecard template
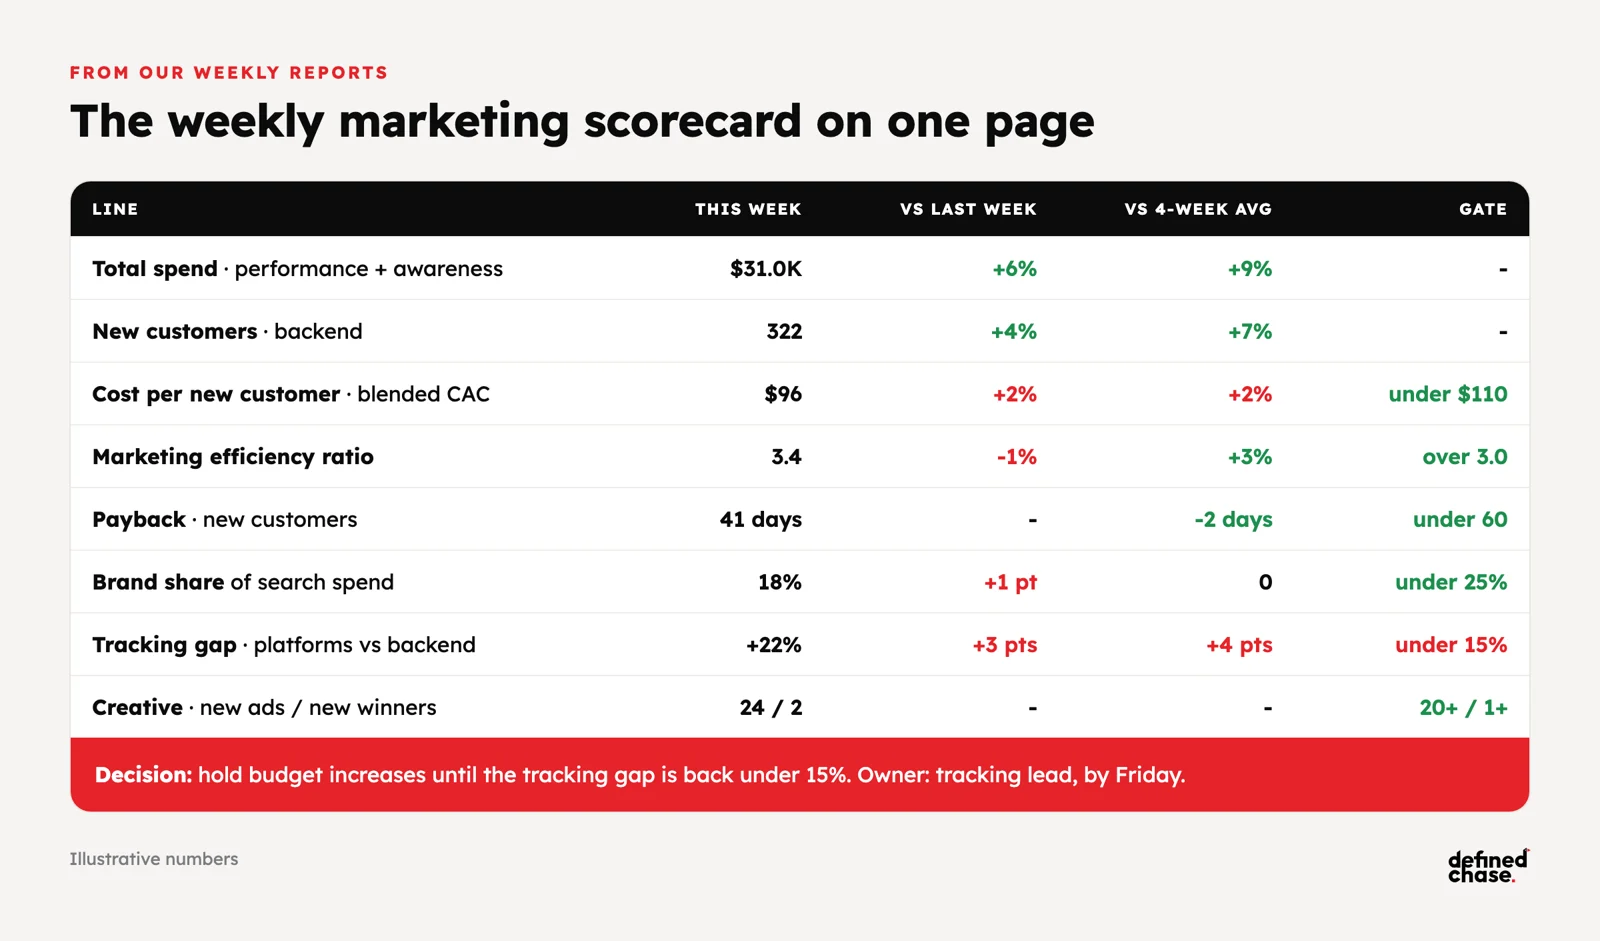
A marketing scorecard is one page that shows whether paid media is buying customers at a cost the business can afford, and what changes this week. Keep it to about ten lines. Each line needs a source everyone agrees on, and three comparisons: last week, the four-week average and the gate.
| Line | What it shows | Source |
|---|---|---|
| Total spend | All paid channels, split performance vs awareness | Ad platforms |
| New customers | First orders, paid subscriptions or qualified deals | Your backend or CRM |
| Cost per new customer | Total spend divided by new customers (blended CAC) | Spend and backend |
| Marketing efficiency ratio | Total revenue divided by total ad spend | Finance and platforms |
| Payback or first-order margin | How fast a new customer pays back what it cost | Finance |
| Revenue minus spend | The balance paid media leaves, by channel | Backend and platforms |
| Brand vs non-brand | How much “performance” is people who already knew you | Search platforms |
| Tracking gap | Platform-claimed conversions vs backend for the same week | Platforms and backend |
| Creative flow | New ads launched and new winners this week | Ad platforms |
| The decision | One sentence: what changes, who does it, by when | The owner |
The comparisons matter as much as the lines. Week over week shows noise. The four-week average shows the trend. The gate, agreed before the quarter starts, decides whether budget goes up. Our own weekly reports show each number against last week, four weeks ago and last year, and split performance from awareness spend so brand budgets do not hide inside a blended cost per acquisition.
Budget rules that make the scorecard decide
A scorecard nobody acts on is another report. Agree the rules before the numbers arrive:
| If the scorecard shows | Then |
|---|---|
| Cost per new customer under the gate for two to four weeks | Raise budget on that channel in steps, then hold and read again |
| Cost per new customer over the gate for two weeks | Stop increases, find the cause (creative fatigue, page, offer, tracking) before cutting |
| Tracking gap growing | Freeze budget changes until platform and backend numbers tell one story again |
| Non-brand flat while brand grows | Treat it as demand capture, not growth, and fund demand creation |
| No new winning ads for three weeks | Raise creative volume before raising spend |
The gate is the number that has to hold before budget goes up, usually cost per new customer or payback. Write it down with the date you will review it. That turns arguments about opinions into a check against a number.
How to set it up in 30 days
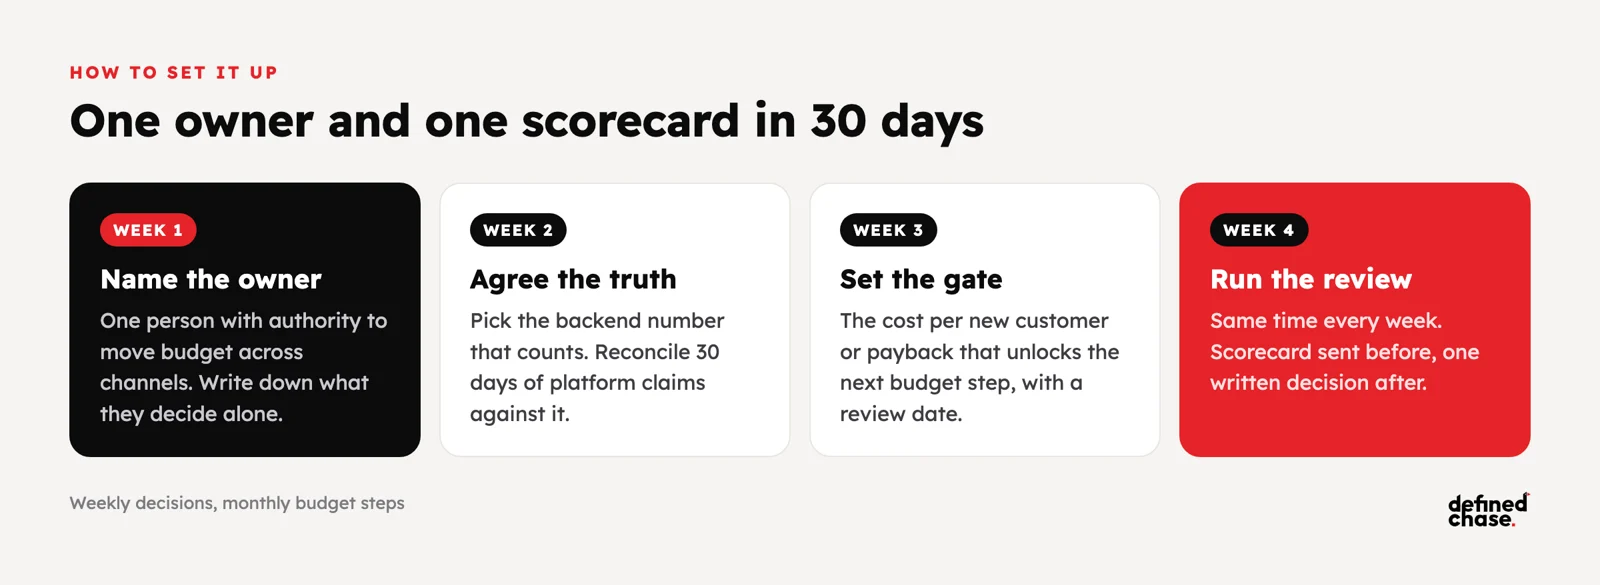
- Week 1: name the owner. One person, with authority to move budget across channels. Write down what they decide alone and what needs the CEO.
- Week 2: agree the source of truth. Which backend number counts as a new customer. Run a 30-day reconciliation of platform conversions against it and put the gap on the scorecard.
- Week 3: set the gate. The cost per new customer or payback that unlocks the next budget step, and the review date.
- Week 4: run the first weekly review. Same day and time every week, the scorecard sent before the meeting, one written decision after it.
If week 2 shows the platforms claiming far more than the backend, start with our guide to server-side tracking before you scale. A scorecard built on numbers nobody trusts makes the arguments worse, not better.
Agency, in-house or both: who should hold the number
The owner seat can sit inside your company or with a partner, but someone on your side must be able to read the scorecard and challenge it. On our calls, the most common failure is an agency that runs the accounts with nobody inside holding it to a number, or an in-house marketer who owns the number on paper but carries five other jobs. We compared the models in agency vs in-house paid media at $100K+ a month. Whichever you pick, the scorecard and the budget rules should not change.
How we run it at Defined Chase
We work with brands spending $100K+ a month that want to spend more. A strategy lead owns the full number with you: spend, new customers, cost per new customer and payback across every channel we run. You get a written decision update every week, built from your backend numbers rather than platform claims, and a monthly review with the budget owner. Budget goes up only when the agreed gate holds, and you keep the ad accounts, the data and the plan. See how we run performance marketing for brands at this budget, or start with a free Growth Map Call to find what is capping your spend.
FAQ
What is a marketing scorecard?
A one-page weekly view of whether marketing is buying customers at a cost the business can afford. It shows about ten numbers from trusted sources, each against last week, the four-week average and an agreed target, plus one written decision.
What is the difference between a scorecard and a dashboard?
A dashboard shows everything and decides nothing. A scorecard shows the few numbers that decide budget, compared with a gate, and ends with a decision. Keep dashboards for the channel teams and the scorecard for the owner and the CEO.
Which metrics belong on a paid media scorecard?
Total spend, new customers from your backend, cost per new customer (blended CAC), marketing efficiency ratio, payback or first-order margin, brand vs non-brand split, the tracking gap and creative flow. Platform ROAS can sit underneath, but it should not decide budget on its own.
Who should own the full marketing number?
One named person with authority to move budget across channels: a head of growth, a CMO, a founder or a senior partner lead. Split ownership by channel is the most common reason budgets stop growing.
How often should the scorecard be reviewed?
Weekly for decisions, monthly for the bigger budget step with the budget owner. Daily numbers are too noisy to move budget on at this level of spend. For the monthly page the CEO reads, see our CEO marketing report guide.
What is a good marketing efficiency ratio?
It depends on your margins and how much revenue would come without ads. Set the target from payback: the ratio at which new customers pay back their cost within the period your cash allows. Track the trend each week rather than chasing a benchmark.
Updated 19 October 2026.
How we do this for clients: Performance marketing for $100K+/month brands →
Want to scale your ad spend?
On a free Growth Map Call we find what is capping your ad spend and the next 1 to 3 steps.
Attend a Growth Map CallRelated articles
Agency vs In-House Paid Media at $100K+ a Month: How to Decide
Short answer: at $100K+ a month, the choice is not really agency or in-house. It is whether one owner is accountable for…
Oct 17, 2026 · 7 min readWhat Caps Ad Spend: 8 Problems From 222 Growth Strategy Calls
Short answer: across 222 growth strategy calls with brands that spend on paid media, the things that cap ad spend are rarely…
Oct 17, 2026 · 4 min readWhy Customer Acquisition Cost Rises When You Scale Ads (and What to Fix First)
Short answer: customer acquisition cost rises when you scale ads because every extra dollar reaches people who are less likely to buy,…
Oct 16, 2026 · 7 min read